FinEdge Finance:
Loan Portfolio Analytics
A strategic dashboard designed to bridge the gap between Sales Velocity and Credit Risk monitoring for a North Indian NBFC.
FinEdge Finance operates across North India with a diverse retail loan portfolio. The goal of this project was to design a clean, insight-rich analytical view that allows leadership to quickly understand loan health, customer risk profiles, and business growth patterns.
View Live DashboardDomain
Banking (BFSI)Role
Data AnalystTools
Power BI, DAXTimeline
2 WeeksProject Overview
The financial sector relies heavily on timely insights to monitor portfolio performance, detect risk early, and plan future strategies. This dashboard was developed to analyze:
Growth & Volume
Overall AUM movement, Loan disbursement trends, and Active loan account growth.
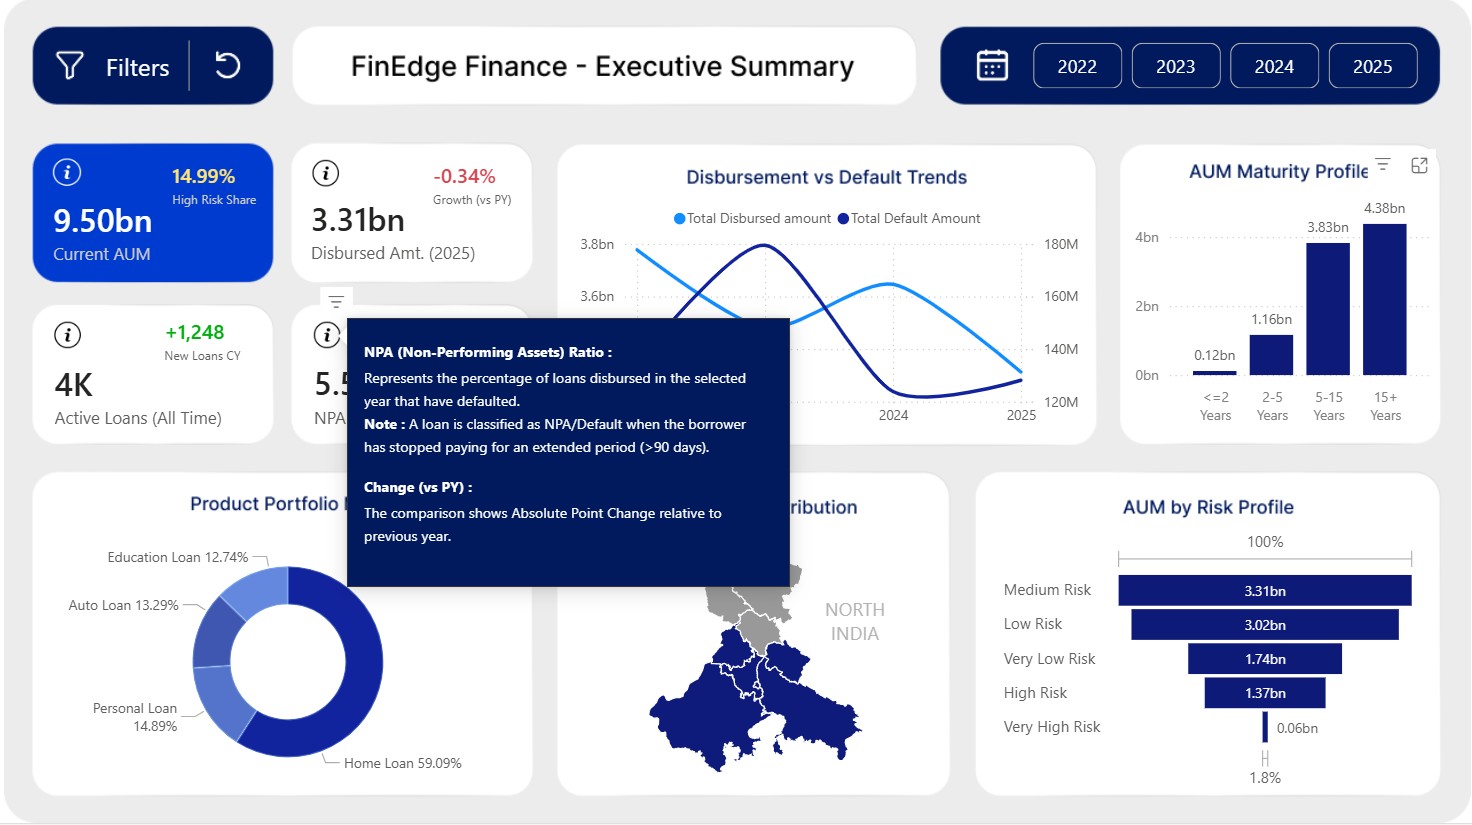
Risk & NPA
Loan disbursement vs. default trends, NPA ratio fluctuations, and Risk segmentation.
Composition
Geographic contribution, Product-level portfolio mix, and Maturity distribution.
The design focuses on clarity, minimalism, and an intuitive reading experience — ideal for high-level decision-making.
Dataset & Tech Stack
Dataset Summary
The dataset was created from scratch using AI (Python) to simulate a realistic Financial Institution's portfolio.
Key Fields:
Total Records
5,200+Timeline
2022 - 2025Granularity
Loan LevelTech Stack
An End-to-End implementation pipeline.
Business Problem
The Executive Visibility Gap
The Regional Directors at FinEdge Finance lacked a consolidated view of their North India operations. They were relying on disjointed reports that separated "Sales Performance" from "Credit Risk," leading to blind spots in decision-making.
They required a single-pane-of-glass dashboard to answer:
"Are we growing profitably, or are we accumulating toxic assets in high-volume regions?"
One-Page Executive Monitor
To solve this, I designed a unified one-page view that integrates Sales, Operations, and Finance metrics into a seamless user experience.
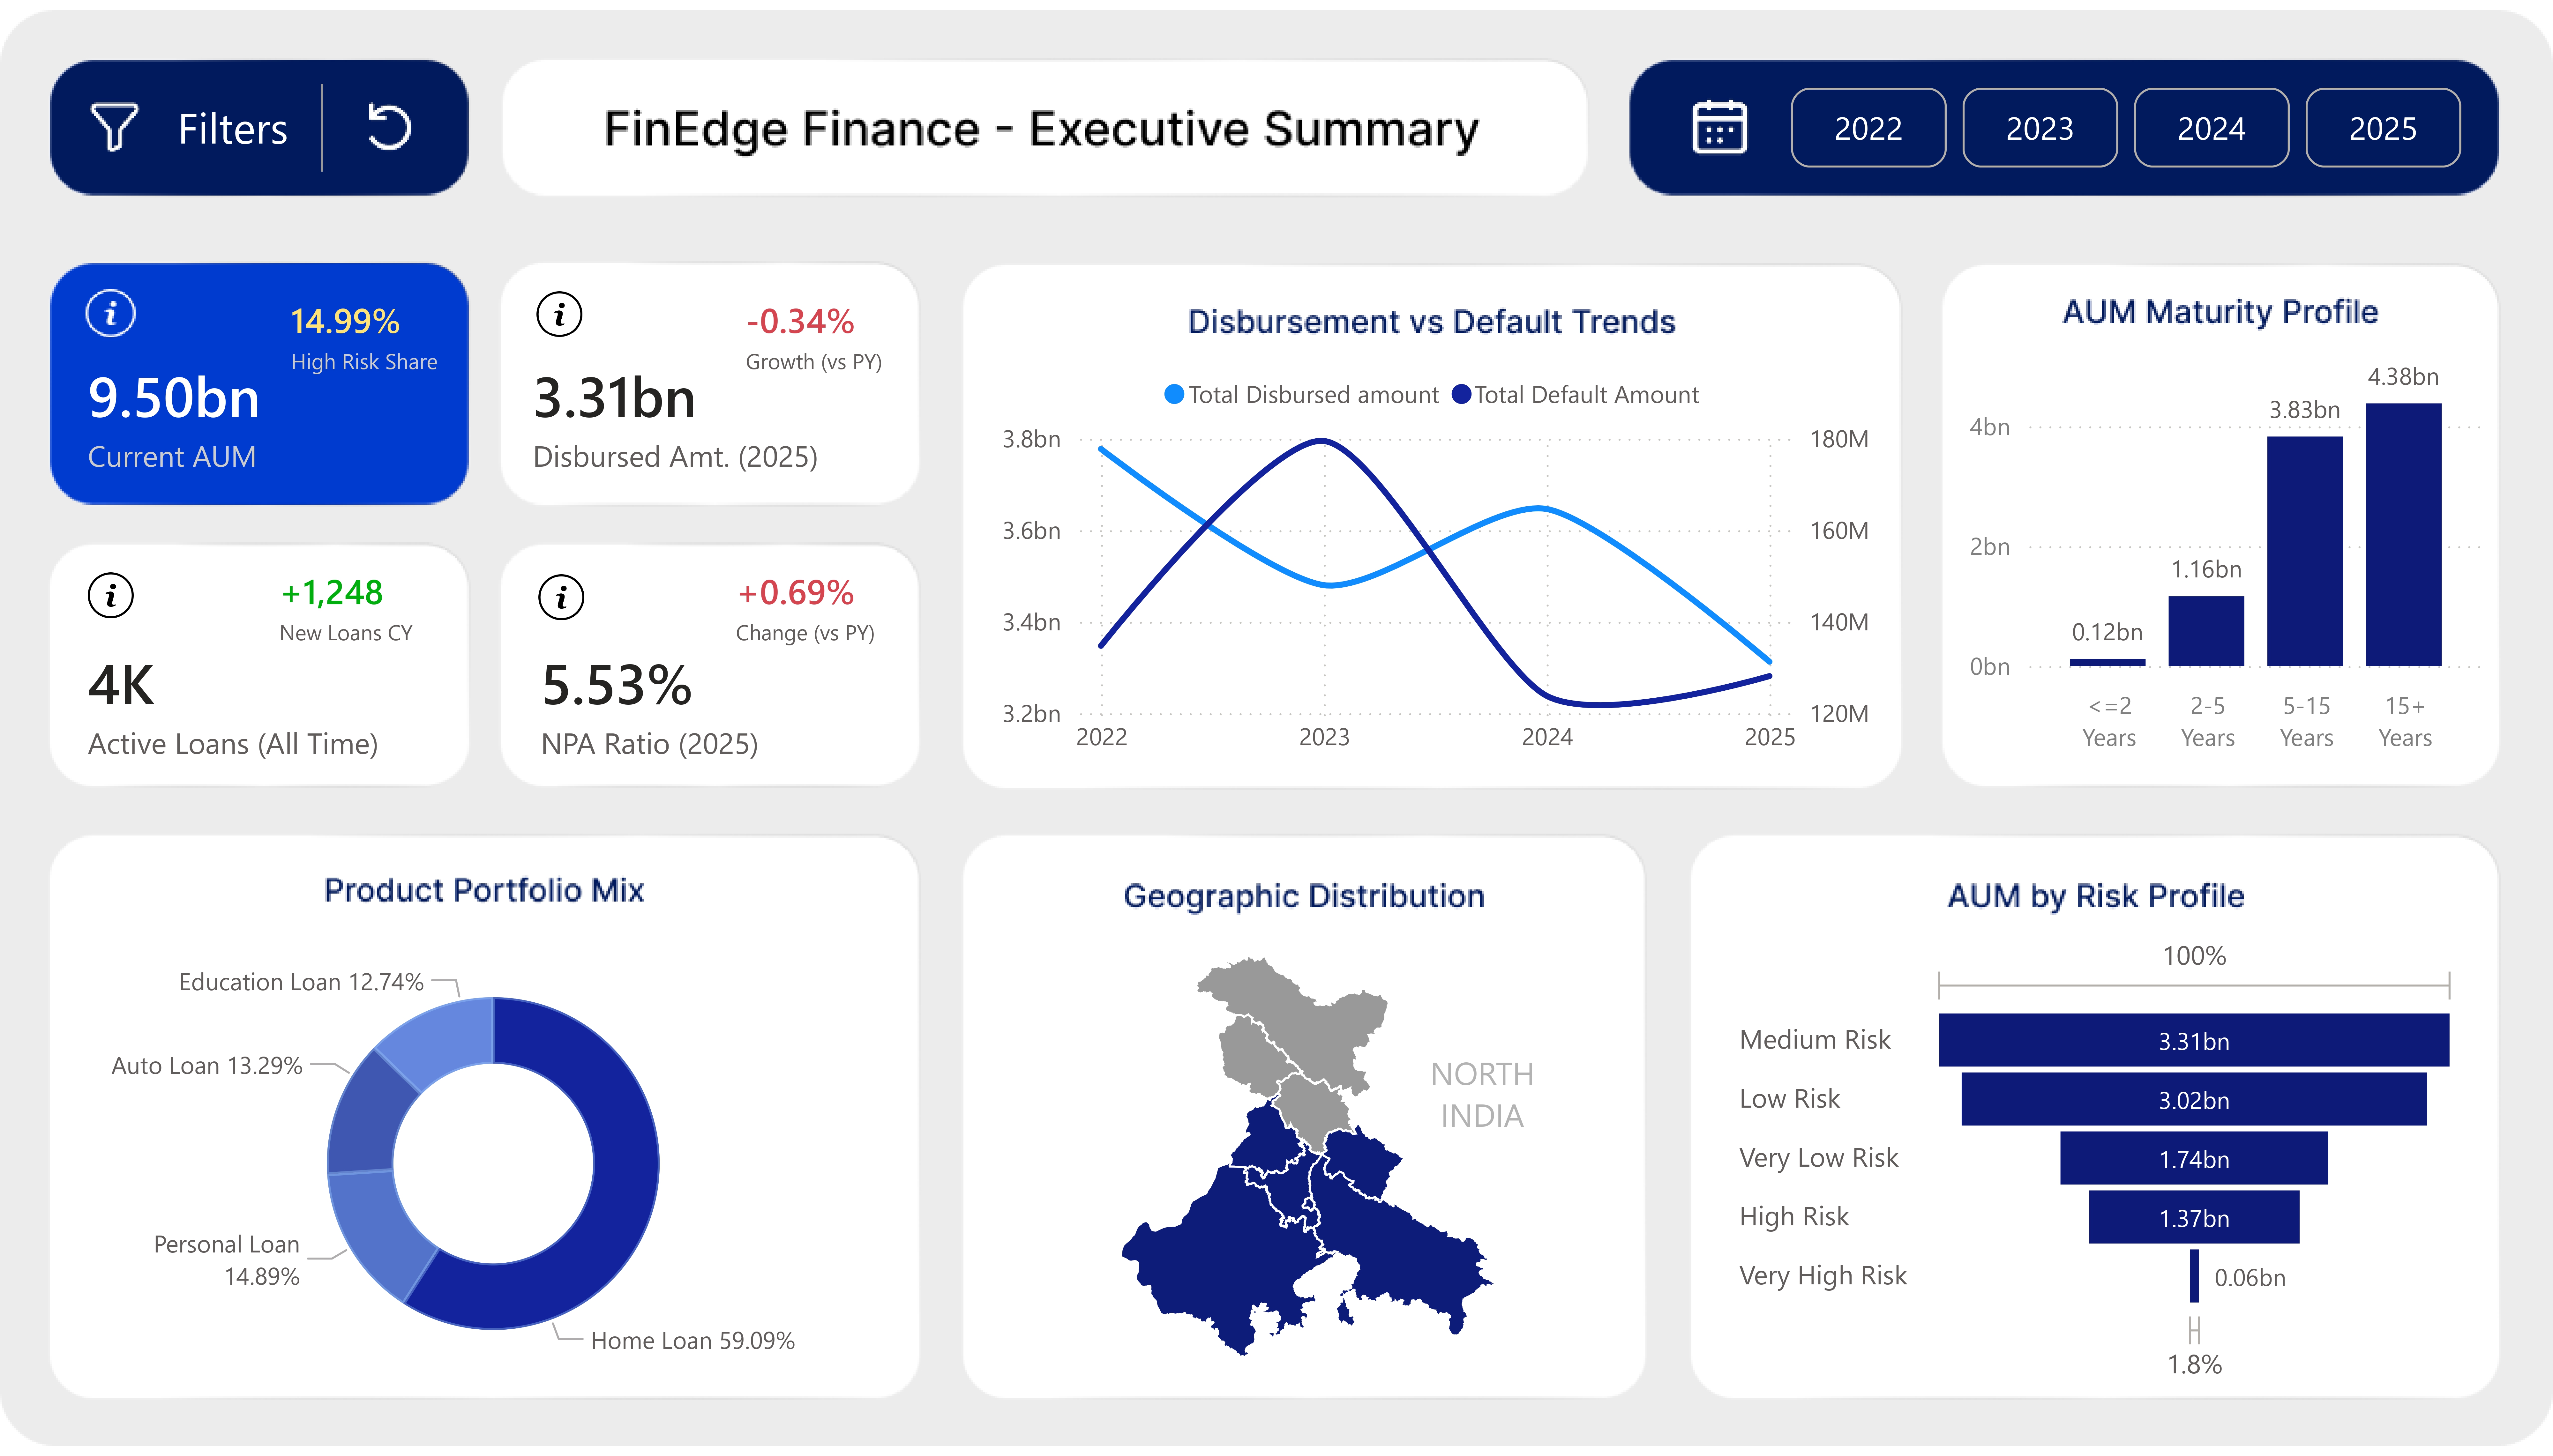
Insights & Interpretation
Disbursement vs Default Trends
- Disbursement peaked in 2023 and gradually stabilised.
- Default amounts increased slightly toward 2024, signalling early stress.
- The decline in defaults in 2025 reflects successful recovery or better credit screening.
AUM Maturity Profile
- Majority of AUM lies in 15+ years category (₹4.38bn).
- Long-tenure loans indicate stable future interest income.
- Short-term maturity (≤2 years) is minimal, giving low liquidity pressure.
Product Portfolio Mix
- Home Loans dominate with 59.09% share — typical for retail lending.
- Strong revenue potential from secured loans.
- Personal and Auto loans have balanced contributions.
Geographic Distribution
- The loan portfolio is concentrated in North India, particularly Delhi, Haryana, and Punjab region.
- Enables region-specific risk and marketing planning.
AUM by Risk Profile
- Majority of customers fall under Medium and Low risk categories.
- Very High Risk segment is minimal — good for portfolio stability.
- High Risk AUM needs monitoring to avoid future NPA spikes.
What I Learned
-
Fair Time Intelligence
I learned how to implement dynamic YTD logic in DAX to solve the "Incomplete Year" comparison problem, ensuring fair benchmarking between Jan-Nov 2025 and Jan-Nov 2024.
-
Risk Modeling
I learned to cross-reference quantitative data (Loan Amount) with qualitative data (Risk Profile based on Income & CIBIL) to tell a meaningful story beyond just "Sales numbers."
-
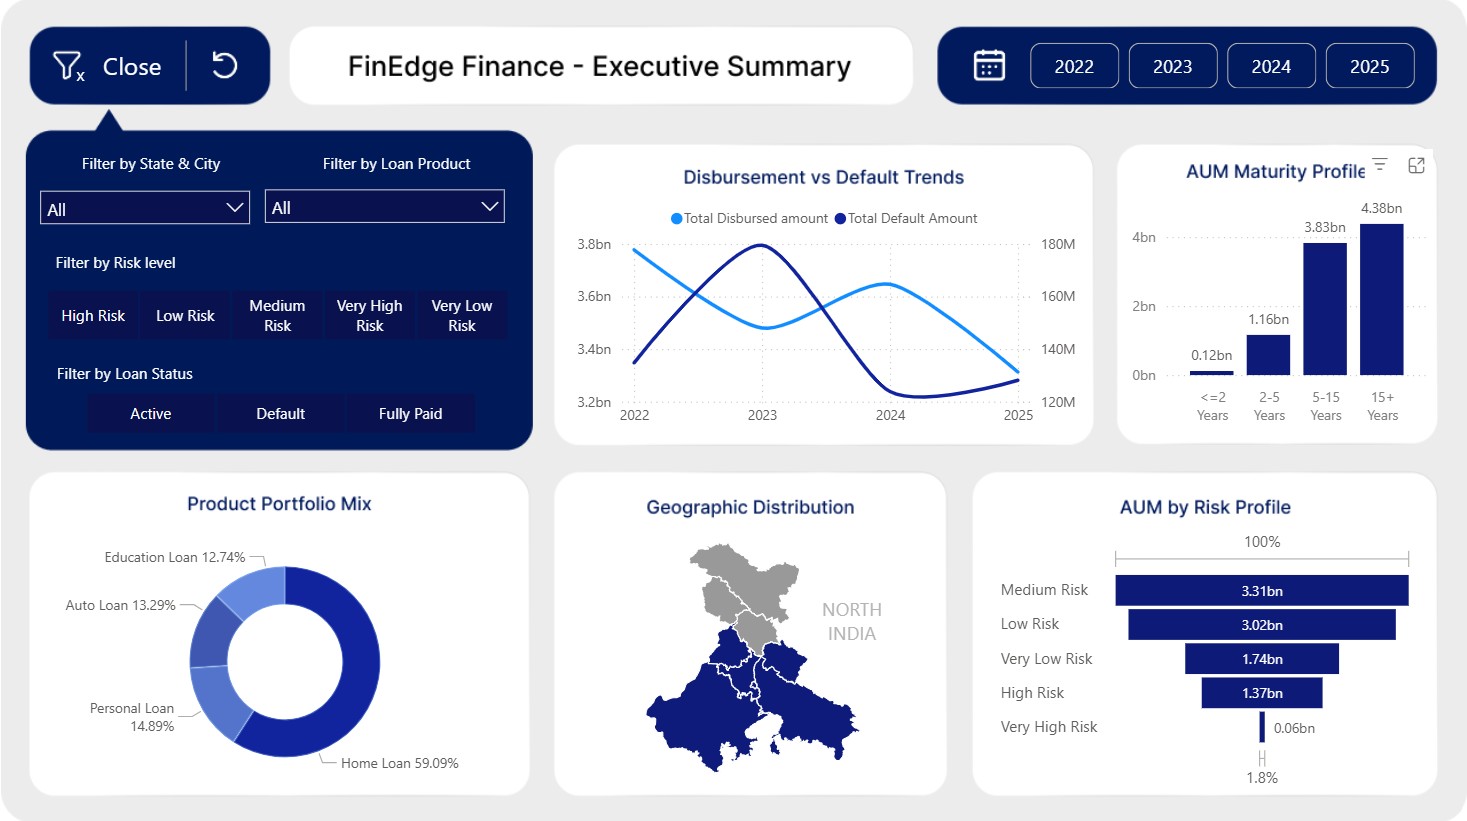
Advanced UX
Moving beyond standard slicers, I built a custom app-like navigation experience using Bookmarks and Selection Panes to maximize screen real estate.
Conclusion
This dashboard offers a structured, executive-level view of FinEdge Finance’s loan portfolio. With insights into AUM trends, NPAs, risk segmentation, and geographic performance, it supports:
- • Credit risk management
- • Disbursement planning
- • Product-level strategy
- • Regional expansion decisions
This project demonstrates my ability to work with financial data, build intuitive dashboards, and create meaningful insights for business stakeholders.